SEM 6 part 4
PRINCIPLES AND APPLICATIONS OF REMOTE SENSING, GIS AND GPS
UNIT:1 REMOTE SENSING
TOPIC WISE EXPLANATION
Basic concept of REMOTE SENSING
Remote Sensing is defined as the science and technology by which the characteristics of objects of interest can be identified, measured or analyzed the characteristics without direct contact.
Electro-magnetic radiation which is reflected or emitted from an object is the usual source of remote sensing data. However any media such as gravity or magnetic fields can be utilized in remote sensing.
A device to detect the electro-magnetic radiation reflected or emitted from an object is called a "remote sensor" or "sensor". Cameras or scanners are examples of remote sensors.
A vehicle to carry the sensor is called a "platform". Aircraft or satellites are used as platforms.
The technical term "remote sensing" was first used in the United States in the 1960's, and encompassed photogrammetry, photo-interpretation, photo-geology etc. Since Landsat-1, the first earth observation satellite was launched in 1972, remote sensing has become widely used.
The characteristics of an object can be determined, using reflected or emitted electro-magnetic radiation, from the object. That is, "each object has a unique and different characteristics of reflection or emission if the type of deject or the environmental condition is different."Remote sensing is a technology to identify and understand the object or the environmental condition through the uniqueness of the reflection or emission.
This concept is illustrated in the below given figure


COMPONENTS OF REMOTE SENSING
electromagnetic radiation (EM radiation or EMR) refers to the waves (or their quanta, photons) of the electromagnetic field, propagating (radiating) through space carrying electromagnetic radiant energy. It includes radio waves, microwaves, infrared, (visible) light, ultraviolet, X-, and gamma radiation

The electromagnetic waves that compose electromagnetic radiation can be imagined as a self-propagating transverse oscillating wave of electric and magnetic fields. This diagram shows a plane linearly polarized EMR wave propagating from left to right (X axis). The electric field is in a vertical plane (Z axis) and the magnetic field in a horizontal plane (Y axis). The electric and magnetic fields in EMR waves are always in phase and at 90 degrees to each other.Classically, electromagnetic radiation consists of electromagnetic waves, which are synchronized oscillations of electric and magnetic fields that propagate at the speed of light through a vacuum. The oscillations of the two fields are perpendicular to each other and perpendicular to the direction of energy and wave propagation, forming a transverse wave. The wavefront of electromagnetic waves emitted from a point source (such as a lightbulb) is a sphere. The position of an electromagnetic wave within the electromagnetic spectrum could be characterized by either its frequency of oscillation or its wavelength. The electromagnetic spectrum includes, in order of increasing frequency and decreasing wavelength: radio waves, microwaves, infrared radiation, visible light, ultraviolet radiation, X-rays and gamma rays.
Electromagnetic waves are produced whenever charged particles are accelerated, and these waves can subsequently interact with other charged particles. EM waves carry energy, momentum and angular momentum away from their source particle and can impart those quantities to matter with which they interact. Quanta of EM waves are called photons, whose rest mass is zero, but whose energy, or equivalent total (relativistic) mass, is not zero so they are still affected by gravity. Electromagnetic radiation is associated with those EM waves that are free to propagate themselves ("radiate") without the continuing influence of the moving charges that produced them, because they have achieved sufficient distance from those charges. Thus, EMR is sometimes referred to as the far field. In this language, the near field refers to EM fields near the charges and current that directly produced them, specifically, electromagnetic induction and electrostatic induction phenomena.
In the quantum theory of electromagnetism, EMR consists of photons, the elementary particles responsible for all electromagnetic interactions. Quantum effects provide additional sources of EMR, such as the transition of electrons to lower energy levels in an atom and black-body radiation. The energy of an individual photon is quantized and is greater for photons of higher frequency. This relationship is given by Planck's equation E = hν, where E is the energy per photon, ν is the frequency of the photon, and h is Planck's constant. A single gamma ray photon, for example, might carry ~100,000 times the energy of a single photon of visible light.
The effects of EMR upon chemical compounds and biological organisms depend both upon the radiation's power and its frequency. EMR of visible or lower frequencies (i.e., visible light, infrared, microwaves, and radio waves) is called non-ionizing radiation, because its photons do not individually have enough energy to ionize atoms or molecules. The effects of these radiations on chemical systems and living tissue are caused primarily by heating effects from the combined energy transfer of many photons. In contrast, high ultraviolet, X-rays and gamma rays are called ionizing radiation since individual photons of such high frequency have enough energy to ionize molecules or break chemical bonds. These radiations have the ability to cause chemical reactions and damage living cells beyond that resulting from simple heating, and can be a health hazard.
Sensors and sensor carrying platform
In the broadest definition, a sensor is an electronic component, module, or subsystem whose purpose is to detect events or changes in its environment and send the information to other electronics, frequently a computer processor. A sensor is always used with other electronics, whether as simple as a light or as complex as a computer.
Sensors are used in everyday objects such as touch-sensitive elevator buttons (tactile sensor) and lamps which dim or brighten by touching the base, besides innumerable applications of which most people are never aware. With advances in micromachinery and easy-to-use microcontroller platforms, the uses of sensors have expanded beyond the traditional fields of temperature, pressure or flow measurement, for example into MARG sensors. Moreover, analog sensors such as potentiometers and force-sensing resistors are still widely used. Applications include manufacturing and machinery, airplanes and aerospace, cars, medicine, robotics and many other aspects of our day-to-day life.
Types of Platform
Platform is a stage to mount the camera or sensor to acquire the information about a target under investigation. Based on its altitude above earth surface, platforms may be classified as
1:-Ground Borne
2:-Air Borne
3:-Space borne
Ground Base Platform
The ground based remote sensing system for earth resources studies are mainly used for collecting the ground truth or for laboratory simulation studies.
Air borne Platform
Aircrafts are generally used to acquire aerial photographs for photo-interpretation and photogrammetric purposes. Scanners are tested against their utility and performance from these platforms before these are flown onboard satellite missions.
Space borne Platform
Platforms in space are not affected by the earth's atmosphere. These platforms are freely moving in their orbits around the earth, and entire earth or any part of the earth can be covered at specified intervals. The coverage mainly depends on the orbit of the satellite. It is through these space borne platforms, we get the enormous amount of remote sensing data and as such the remote sensing has gained international popularity.
Remote sensing satelite
A satellite with remote sensors to observe the earth is called a remote-sensing satellite, or earth observation satellite. Remote-Sensing Satellites are characterized by their altitude, orbit and sensor.
TRIOS Series (1960-1965:The Television and Infrared Observation Satellites.
NOAA:It is the first generation of National Oceanic and Atmospheric Administration satellites and was as the first operational remote sensing satellite system.
The third generation NOAA satellites are also successfully used for vegetation monitoring, apart from meteorological monitoring. It is equipped with Advanced Very High Resolution Radiometer (AVHRR) sensors, and is established at an altitude of 850 km. in polar orbit.
GMS:Geo-synchronous meteorological satellite. It is established at an altitude of 36,000 km, and its main purpose is meteorological observations
LANDSAT:is established at an altitude of 700 Kms is a polar orbit and is used mainly for land area observation.
Other remote sensing satellite series in operations are:SPOT, MOS, JERS, ESR, RADARSAT, IRS etc.
Type Of Remote Sensing
in simple term there are two type of remote sensors ACTIVE and PASSIVE. The active sensors have their own source of energy where as the Passive sensors depend on external source of illumination
Aerial Remote Sensing: aerial remote sensing refers to the collection of data of the earth surface with the help of airborn vehicals,drones etc.Through the use of traditional and innovative equipment, such as digital cameras and videocameras, thermal cameras, Laser Scanner and hyperspectral sensors, aerial remote sensing allows us a wide array of possible applications, such as territorial and environmental data capture and the monitoring of technological networks and infrastructures.
Satellite Remote sensing: satellite remote sensings is the act of acquiring of information directly from the satellite.sensors are looking through a layer ofatmosphere separating the sensors from the Earth's surface being observed. Hence, it is essential to understand the effects of atmosphere on the electromagnetic radiation travelling from the Earth to the sensor through the atmosphere. The atmospheric constituents cause wavelength dependentabsorption and scattering of radiation. Theseeffects degrade the quality of images. Some of the atmospheric effects can be corrected before the images are subjected to further analysis and interpretation.A consequence of atmospheric absorption is that certain wavelength bands in the electromagnetic spectrum are strongly absorbed and effectively blocked by the atmosphere. The wavelength regions in the electromagnetic spectrum usable for remote sensing are determined by their ability to penetrate atmosphere. These regions are known as the atmospheric transmission windows. Remote sensing systems are often designed to operate within one or more of the atmospheric windows. These windows exist in the microwave region, some wavelength bands in the infrared, the entire visible region and part of the near ultraviolet regions. Although the atmosphere is practically transparent to x-rays and gamma rays, these radiations are not normally used in remote sensing of the earth.
Concept Of Photogrammetry
Photogrammetry is the science of making measurements from photographs, especially for recovering the exact positions of surface points. Photogrammetry is as old as modern photography, dating to the mid-19th century and in the simplest example, the distance between two points that lie on a plane parallel to the photographic image plane, can be determined by measuring their distance on the image, if the scale (s) of the image is known.
Photogrammetric analysis may be applied to one photograph, or may use high-speed photography and remote sensing to detect, measure and record complex 2-D and 3-D motion fields by feeding measurements and imagery analysis into computational models in an attempt to successively estimate, with increasing accuracy, the actual, 3-D relative motions.
From its beginning with the stereoplotters used to plot contour lines on topographic maps, it now has a very wide range of uses.
Photogrammetric methods
Photogrammetry has been defined by the American Society for Photogrammetry and Remote Sensing (ASPRS) as the art, science, and technology of obtaining reliable information about physical objects and the environment through processes of recording, measuring and interpreting photographic images and patterns of recorded radiant electromagnetic energy and other phenomena.
Photogrammetry uses methods from many disciplines, including optics and projective geometry. Digital image capturing and photogrammetric processing includes several well defined stages, which allow to generate 2D or 3D digital models of the object as an end product. The data model on the right shows what type of information can go into and come out of photogrammetric methods.
The 3-D co-ordinates define the locations of object points in the 3-D space. The image co-ordinates define the locations of the object points' images on the film or an electronic imaging device. The exterior orientation of a camera defines its location in space and its view direction. The inner orientation defines the geometric parameters of the imaging process. This is primarily the focal length of the lens, but can also include the description of lens distortions. Further additional observations play an important role: With scale bars, basically a known distance of two points in space, or known fix points, the connection to the basic measuring units is created.
Each of the four main variables can be an input or an output of a photogrammetric method.
Algorithms for photogrammetry typically attempt to minimize the sum of the squares of errors over the coordinates and relative displacements of the reference points. This minimization is known as bundle adjustment and is often performed using the Levenberg–Marquardt algorithm.
Aerial Photograph
What is Aerial Photograph?
Aerial photography is the acquisition of a vertical image with a specialize camera installed on board of an airplane, equipped for this type of work.
Airborne acquisitions are always performed in such a manner that two consecutive photographs have a side and forward overlap. These overlaps enable a three dimensional (3D) observation of the territory, with the help of a specialized tool. The optical phenomenon, which makes it possible to see in 3D, is called the stereoscopy.
TYPE OF AERIAL PHOTOGRAPHS
Aerial photography most commonly used by military personnel may be divided into two major types, the vertical and the oblique. Each type depends upon the attitude of the camera with respect to the earth's surface when the photograph is taken.
1 VERTICAL: A vertical photograph is taken with the camera pointed as straight down as possible. Allowable tolerance is usually + 3° from the perpendicular (plumb) line to the camera axis. The result is coincident with the camera axis. A vertical photograph has the following characteristics:


Relationship of high oblique photograph to the ground.
4 TRIMETROGON:This is an assemblage of three photographs taken at the same time, one vertical and two high obliques, in a direction at right angle to the line of flight. The obliques, taken at an angle of 60° from the vertical, sidelap the vertical photography, producing composites from horizon to horizon

Relationship of cameras to ground for trimetrogon photography (three cameras).
5 MULTI LENS PHOTOGRAPHY:These are composite photographs taken with one camera having two or more lenses, or by two or more cameras. The photographs are combinations of two, four, or eight obliques around a vertical. The obliques are rectified to permit assembly as verticals on a common plane.6 CONVERGENT PHOTOGRAPHY:These are done with a single twin-lens, wide-angle camera, or with two single-lens, wide-angle cameras coupled rigidly in the same mount so that each camera axis converges when intentionally tilted a prescribed amount (usually 15 or 20°) from the vertical. Again, the cameras are exposed at the same time. For precision mapping, the optical axes of the cameras are parallel to the line of flight, and for reconnaissance photography, the camera axes are at high angles to the line of flight.
7 PANORAMIC:The development and increasing use of panoramic photography in aerial reconnaissance has resulted from the need to cover in greater detail more and more areas of the world.
(1) To cover the large areas involved, and to resolve the desired ground detail, present-day reconnaissance systems must operate at extremely high-resolution levels. Unfortunately, high-resolution levels and wide-angular coverage are basically contradicting requirements.
(2) A panoramic camera is a scanning type of camera that sweeps the terrain of interest from side to side across the direction of flight. This permits the panoramic camera to record a much wider area of ground than either frame or strip cameras. As in the case of the frame cameras, continuous cover is obtained by properly spaced exposures timed to give sufficient overlap between frames. Panoramic cameras are most advantageous for applications requiring the resolution of small ground detail from high altitudes.
HISTORY OF REMOTE SENSING

First known photograph, taken in 1827.
In 1827, Joseph Nicephoce Niepce (pronounced Nee-ps) reportedly took the first photograph. He was fascinated with lithography, but unable to draw, his artist son made the images for Niepce's work. In 1814 his son was drafted into the army to fight at Waterloo, and Niepce had to look for another way of obtaining images. Eventually he developed a product that he called Heliographs. His first picture (Figure 1) shows a view from his studio window and required eight hours of exposure time. The picture is difficult to decipher. With the exposure lasting eight hours, the sun had time to move from east to west, appearing to shine on both sides of the building. On January 4, 1829, Niepee entered a partnership arrangement with Louis Jacques Mande Daguerre but the partnership lasted only a few years with Niepee dying in 1833.
Daguerre continued their work and in 1839 announced the development of the process called "daguerrotype." The early daguerreotype pictures had several drawbacks, one of which was the length of the exposure time. The below photograph (Figure 2) illustrates the problem. This photograph, taken from the roof of a tall building, might be considered the first oblique aerial photograph. Taken in 1839, the photograph apparently shows an empty street in Paris during the middle of the day. Due to the long exposure time, moving objects such as people walking and wagons moving were not recorded. The one exception is a man who stopped to have his shoes shined (see bottom left enlargement in the large picture). Over time the daguerrotype process improved but was eventually replaced by newer and better processes. In the United States, daguerrotype photographs were popularly called “tintypes.” By 1851, Scott Archer of England developed the process of coating glass plates with sensitized silver compounds. The plates were referred to as “wet plates” and the process had reduced the exposure time to one-tenth that of the daguerrotype process.

1839 aerial photograph of a supposedly empty street in Paris, note enlargement.

Nadar caricaturized in 1862.
Once a technique was established for taking pictures, an adequate aerial platform was needed for taking aerial photographs. The only9 platforms available at the time were balloons and kites. In 1858, Gaspard Felix Tournachon (later known as "Nadar") captured the first recorded aerial photograph from a balloon tethered over the Bievre Valley. However, the results of his initial work were apparently destroyed. On the other hand his early efforts were preserved in a caricature (Figure 3) prepared by Honoré Daunier for the May 25, 1862 issue of Le Boulevard. Nadar continued his various endeavors to improve and promote aerial photography. In 1859, he contacted the French Military with respect to taking "military photos" for the French Army's campaign in Italy and preparing maps from aerial photographs. In 1868 he ascended several hundred feet in a tethered balloon to take oblique photographs of Paris.
On October 13, 1860, James Wallace Black, accompanied by Professor Sam King, ascended to an altitude of 1200 feet in King's balloon and photographed portions of the city of Boston (Figure 4). A cable held the balloon in place.Black, the photographer, made eight exposures of which only one resulted in a reasonable picture. This is the oldest conserved aerial photograph. He worked under difficult conditions with the balloon, which although tethered, was constantly moving. Combined with the slow speed of the photographic materials being used it was hard to get a good exposure without movement occurring. He also used wet plates and had to prepare them in the balloon before each exposure. After descending to take on more supplies, King and Black went up again with the idea of not only covering Boston but also recording the surrounding countryside. However, they encountered other problems. As they rose, the hydrogen expanded causing the neck of the balloon to open more. This resulted in the gas flowing down on their equipment and turning the plates black and useless. In addition, the balloon took off and they landed in some high bushes in Marshfield, Massachusetts, about thirty miles away from their beginning point. It was obvious that the balloon possessed problems in being an aerial platform.

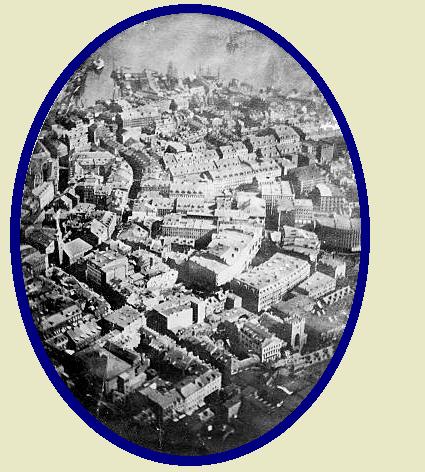
Black’s 1860 photo of Boston and Nadar’s 1868 photo of Paris.
M. Arthur Batut (Figure 6a) took the first aerial photographs using a kite. It was taken over Labruguiere, France in the late 1880s. The camera, attached directly to the kite, had an altimeter that encoded the exposure altitude on the film allowing scaling of the image Figure 6c). A slow burning fuse, responding to a rubber band-driven device, actuated the shutter within a few minutes after the kite was launched. A small flag dropped once the shutter was released to indicate that it was time to bring down the kite. Batut took his first aerial photograph in May 1888. However, due to the shutter speed being too slow, the image was not very clear. After some modification to the thickness of the rubber band a good shutter speed was obtained.


FIGURES: Batut, his first aerial photograph taken over Labruguiere, France, and his kite with camera mounted in the middle.
1900-1914
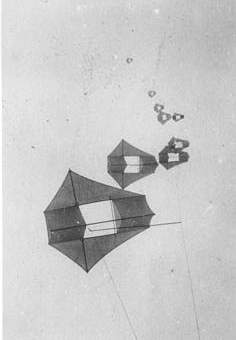
In 1906, George R. Lawrence took oblique aerial pictures of San Francisco after the earthquake and fires (Figure 8). Using between nine and seventeen large kites to lift a huge camera (49 pounds) he took some of the largest exposures (about 48 x 122 cm or 18 x 48 in.) ever obtained from an aerial platform. His camera was designed so that the film plate curved in back and the lens fitted low on the front, providing panorama images (Figure 7a). The camera was lifted to a height of approximately 2,000 feet and an electric wire controlled the shutter to produce a negative. Lawrence designed his own large-format cameras and specialized in aerial views. He used ladders or high towers to photograph from above. In 1901 he shot aerial photographs from a cage attached to a balloon. One time, at more than 200 feet above Chicago, the cage tore from the balloon, and Lawrence and his camera fell to the ground. Fortunately telephone and telegraph wires broke his fall; he landed unharmed. He continued to use balloons until he developed his method for taking aerial views with cameras suspended from unmanned kites, a safer platform from his perspective. He developed a means of flying Conyne kites in trains and keeping the camera steady under varying wind conditions. This system he named the 'Captive Airship'.

FIGURES: Lawrence's camera and one of his Captive Airships

FIGURE: One of Lawrence's 1906 photographs of San Francisco
In 1903, Julius Neubranner, photography enthusiast, designed and patented a breast-mounted aerial camera for carrier pigeons (Figure 10). Weighing only 70 grams the camera took automatic exposures at 30-second intervals along the flight line flown by a pigeon. Although faster than balloons they were not always reliable in following their flight paths. The birds were introduced at the 1909 Dresden International Photographic Exhibition. Picture postcards of aerial photographs taken over the exhibition were very popular. They were used at other fairs and for military surveillance. Two sample pictures are provided below (Figure 9a-b). One can see in the one picture the tips of the bird's wings as it flew across a palace.


FIGURES: Aerial photographs taken by pigeons.

FIGURE: A pigeon with a camera mounted to its breast.
In order for the pigeons to carry such small cameras and take several pictures in one flight, a new type film and a smaller camera system were needed. In the 1870s, George Eastman, born in the rural community of Waterville in upstate New York, was an accountant in Rochester. After working five years in a bank, he became bored with the monotony of the job. In 1878, he decided to take a vacation to the island of Santo Domingo and re-evaluate his life. To record his trip he acquired a wet-plate camera outfit. However, he found the camera and assorted darkroom equipment to be cumbersome and bulky. He would need a small wagon to carry all of the materials and equipment, an arrangement not suited for taking pictures on one's vacation. He soon forgot about the trip to Santo Domingo and became intrigued with the idea of developing a better film and camera system. In 1879, Eastman discovered the formula for making a successful gelatin emulsion covered dry-plate and built a machine for coating dry plates with the emulsion. These developments led to the invention of rolled paper film. The resulting prints were sharp, clear and free from paper grain distortion. In 1889, his company, Kodak, introduced flexible celluloid film and the popularity of photography soared. He now needed a camera to take advantage of the new film. In 1900, outfitted with a simple lens and the ability to handle rolled film, the one-dollar Kodak box camera, called the Brownie, made Kodak and photography almost synonymous. Eastman had not only revolutionized the field of photography but set the stage for new developments in the field of aerial photography. His work was shortly followed in 1903 by the Wright Brothers' first successful flight of a heavier-than-air aircraft. Another type of aerial platform was available.

FIGURE: Aerial photograph taken by Alford Nobel of a Swedish village.
Also in 1903 Alfred Maul, a German industrialist and an engineer, developed a rocket system to take photographs from the air. The system was later referred to as the Maul Camera Rocket. A number of people prior to Maul had conducted various tests with rockets, but basically no practical application was found for them. In 1891 Ludwig Rahrmann had patented a method of attaching a camera to a large caliber artillery gun or rocket. His work inspired Maul to develop his system. In the meantime Alfred Nobel (Nobel Prize fame) had built the first rocket carrying camera. Figure 11 shows an aerial photograph taken by Nobel of a Swedish village in Karlskoga parish. Nobel’s rocket camera system took photos only about 300 feet above land, limiting the field of view to small areas.

Sketch of Maul’s Rocket-Camera System.

Aerial photograph taken from a Maul Camera Rocket.
Maul’s camera was located in the hood section of the rocket and mounted at an oblique downward inclination. The lens looked through a hole in the hood. Wings or blades were provided to keep the rocket from rotating and changing direction, and thereby, maintain the focus of the lens toward the ground. At a flight’s highest point a time-fuse raised the lens’ shutter and at about the same time opened parachutes stored below the camera. The parachutes gradually lowered the rocket to the ground.The above Figure illustrates the procedures and is modified from Maul’s 1904 U.S. patent design. In 1904 the Maul Camera Rocket took an image of a North German landscape from about 1900 feet altitude. From the beginning a military use for this technique was in mind. In August 1906 secret tests occurred before military observers at a German firing range. Following the tests he developed gyroscopic-stabilized plate cameras in 1907 to ensure stable flight and sharper images. Next the rocket camera system was tested by the Austrian Army as a means for reconnaissance in the Turkish-Bulgarian War in 1912/1913. Work on the system was not continued after 1913 due to planes being more effective for taking aerial photographs.
WORLD WAR I


FIGURE: Aerial photographer French air field and during World War I
At the beginning of World War I the military on both sides of the conflict saw the value of using the airplane for reconnaissance work but did not fully appreciate the potential of aerial photography. Initially, aerial observers, flying in two-seater airplanes with pilots, did aerial reconnaissance by making sketch maps and verbally conveying conditions on the ground. They reported on enemy positions, supplies, and movements; however, some observers tended to exaggerate or misinterpret conditions. In some cases, their observations were based on looking at the wrong army. From above, identifying one soldier from another was not easy. One time a German observer indicated that an English unit was running around in great disarray and appeared to be in a state of panic. The English were playing soccer.
Some English observers started using cameras to record enemy positions and found aerial photography easier and more accurate than sketching and observing. The aerial observer became the aerial photographer.Soon all of the nations involved in the conflict were using aerial photography. The maps used by both sides in the Battle of Neuve-Chappelle in 1915 were produced from aerial photographs. By the end of the war the Germans and the British were recording the entire front at least twice a day. Both countries possess up-to-date records of their enemy's trench construction. England estimated that its reconnaissance planes took one-half million photographs during the war, and Germany calculated that if all of its aerial photographs were arranged side by side, they would cover the country six times. The war brought major improvements in the quality of cameras; photographs taken at 15,000 feet (4,572 meters) could be blown up to show footprints in the mud.

FIGURE: Trench development observed at 2000 feet on July 31, 1916.
1920-1939
By World War I the airplane had matured in its development to be used for aerial reconnaissance. However, aerial photographs taken from planes were often highly distorted due to shutter speeds being too slow in relationship to the speed of the plane. Toward the end of the war Sherman M. Fairchild developed a camera with the shutter located inside the lens. This design significantly reduced the distortion problem. In addition, the camera’s magazine would prevent uneven spacing. Fairchild also designed an intervalometer that allowed photos to be taken at any interval. Combined these developments made the Fairchild camera the best aerial camera system available (Figure 17). With modifications, the Fairchild camera remained the desired aerial camera system for the next fifty years.
Like Eastman, Fairchild was born in a small upstate New York town called Oneonta. His father, George W. Fairchild, manufactured time clocks and adding machines. His company along with two others later became IBM and George Fairchild was the company's first president. He also served for twelve years in the U.S. House of Representatives. In his initial years of developing a camera Fairchild benefited from his father’s wealth and influence.


FIGURE: Fairchild’s aerial camera system mounted for vertical photography and equipped for automatic operation. To the right is the intervalometer and in the foreground is the viewfinder. To the right is a portion of the aerial map of Manhattan Island.
Although by 1920 Fairchild had built an aerial camera superior to anything that had existed previously, the war was over and the military was reluctant to invest in the camera except for two training models. He turned his attention to using his camera system for non-military purposes. In 1921, he took a series of 100 overlapping photographs and made an aerial map of Manhattan Island. This aerial map was his first real commercial success and it was used by several New York City agencies and businesses. In 1922, Newark, New Jersey contracted with him to map its bay area. A Connecticut town discovered 1800 buildings not on its tax rolls using an aerial map, and another town, East Haven wanted to reassess its properties but discovered that to conduct a ground survey would take five years and cost $80,000. Fairchild did the work in 60 days at a cost of $7,000. The Canadian company, Laurentide Paper and Pulp, hired him to survey the large, inaccessible forest regions of Canada. Within the first year, 510 square miles were mapped. Fairchild was demonstrating that aerial photography had many non-military uses and could be a successful venture commercially. By the mid-1930’s, Fairchild Aerial Surveys was the largest and most commercially successful aerial photography company in the United States. Fairchild found it necessary to enter the field of manufacturing airplanes in order to have a good solid aerial platform. The open-cockpit biplanes were totally unsatisfactory. He produced high-wing cabin monoplanes. An enclosed, heated cabin protected the camera equipment as well as the photographer and pilot from the weather elements. He now had three companies, one to produce aerial cameras, another to conduct aerial surveys, and a final one to build planes suited to undertake aerial photography. Fairchild’s brilliant camera designs and his strong commitment to aerial photography brought aerial mapping to full maturity. Before his death in 1971, he saw his cameras carried on Apollo 15,16, and 17, and while astronauts explored the lunar surface, his cameras mapped the moon.
In addition to Fairchilds' accomplishments between World War I and World War II,several other significant developments occurred within the field of remote sensing during this period. These developments are outlined below.
WORLD WAR II
World War II brought about tremendous growth and recognition to the field of aerial photography that continues to this day. In 1938, the chief of the German General Staff, General Werner von Fritsch, stated, “The nation with the best photoreconnaissance will win the war.” By 1940, Germany led the world in photoreconnaissance. However, after von Fritsch’s death the quality of German photointelligence declined. When the United States entered the War in 1941, it basically had no experience in military photointerpretation. By the end of the War, it had the best photointerpretation capacity of any nation in the world. In 1945, Admiral J. F. Turner, Commander of American Amphibious Forces in the Pacific, stated that, “Photographic reconnaissance has been our main source of intelligence in the Pacific. Its importance cannot be overemphasized.”
A review of the numerous applications of aerial photoreconnaissance and interpretation during World War II cannot be adequately covered in this instructional module. Thus, just one example will be provided. Peenemunde, the German experimental station for rocket and jet plane development, was located on the Baltic Coast and in 1937 Wernher von Braun and his rocket team were moved to Peenemunde. It was here that after six years of hard work von Braun and hsi team developed the A-4. On October 3, 1942 the A-4 was successfully launched reaching an altitude of sixty miles. It was the world's first launch of a ballistic missile and the first rocket ever to go into the fringes of space. In 1943 the A-4 was ordered into production and renamed the V-2. Shortly thereafter, V-2 rockets were launched against England.
In late 1942 the British Secret Intelligence Service was informed about a new rocket being developed at Peenemunde. An aerial photoreconnaissance plane was sent on June 23, 1943 and obtained the first photo of the V-2 rocket. This aerial photo shows Test Stand VII at the German Testing Center with a V2 rocket on its trailer inside of the test firing area. It also shows possible anti-aircraft gun positions on top of an adjacent building. On August 17 and 18, 1943 the British sent its bombers to Peenemunde and rather than bombing the facility in general, precise targets were selected based on the excellent aerial photography previously obtained. After the bombing a second aerial photoreconnaissance plane was sent to gain photography for assessing the amount of damage


FIGURE: Photo (up) taken June 23, 1943 of the V-2 test lunch site at Peenemunde. Photo (down) taken after bombing raid.
1950's
During the 1950’s, aerial photography continued to evolve from work started during World War II and the Korean War. Color-infrared became important in identifying different vegetation types and detecting diseased and damaged vegetation. Multispectral imagery, that is images taken at the same time but in different portions of the electromagnetic spectrum, was being tested for different applications. Radar technology moved along two paralleling paths, side-looking air-borne radar (SLAR) and synthetic aperature radar (SAR). Westinghouse and Texas Instruments did most of this work for the United States Air Force.
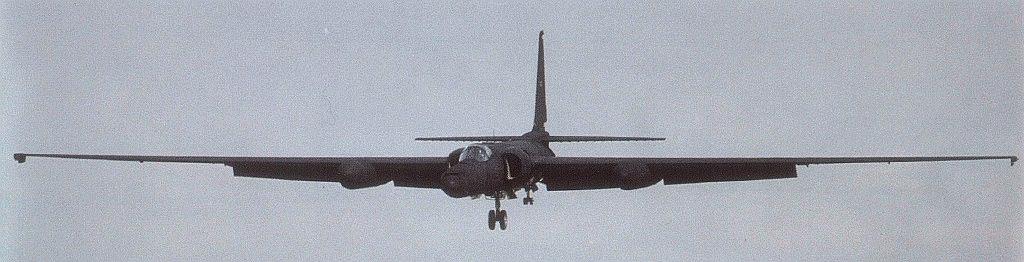
FIGURE: A U-2 landing.
Tensions between the United States and the Soviet Union grew during the 1950’s with the Cold War. The United States needed to know how many missiles, planes, and other military hardware the Soviet Union had and where it was located. Conventional military planes could not fly over the Soviet Union without being shot down and satellite technology had not yet been developed. In the mid-1950’s Clarence L. "Kelly" Johnson at Lockheed's "Skunk Works" in Burbank, CA built the U-2 (Figure 21) for the CIA, under the code-name AQUATONE. President Eisenhower authorized Operation OVERFLIGHT -- covert reconnaissance missions over the Soviet Union -- after the Soviets flatly rejected his Open Skies plan, which would have allowed aircraft from both countries to openly overfly each other's territory. For five years the U-2's cameras took photos of ICBM testing sites and air bases within the Soviet Union, flying at over 70,000 feet, which put the plane out of reach. The aerial photography from the plane proved that no bomber or missile gap existed between the United States and the Soviet Union as was previously suspected. Finally, on May 1, 1960, a U-2 was shot down and the pilot, Francis Gary Powers, was arrested and sent to prison in the Soviet Union. Although the U-2 continues to be used throughout the world for a wide variety of purposes, this event symbolizes the beginning of the use of satellites to look at conditions on the Earth’s surface and the establishment of the term, “Remote Sensing.”INDIAN REMOTE SENSING
IRSFollowing the successful demonstration flights of Bhaskhar and Bhaskara-2 satellites launched in 1979 and 1981, respectively, India began to develop the indigenous Indian Remote Sensing (IRS) satellite program to support the national economy in the areas of agriculture, water resources, forestry and ecology, geology, water sheds, marine fisheries and coastal management.
Towards this end, India established the National Natural Resources Management System (NNRMS) for which the Department of Space (DOS) is the nodal agency, providing operational remote sensing data services.[1] Data from the IRS satellites is received and disseminated by several countries all over the world. With the advent of high-resolution satellites new applications in the areas of urban sprawl, infrastructure planning and other large scale applications for mapping have been initiated.
The IRS system is the largest constellation of remote sensing satellites for civilian use in operation today in the world, with 11 operational satellites. All these are placed in polar Sun-synchronous orbit and provide data in a variety of spatial, spectral and temporal resolutions. Indian Remote Sensing Programme completed its 25 years of successful operations on March 17, 2013.
INTRODUCTION TO GIS
A geographic information system (GIS) is a system designed to capture, store, manipulate, analyze, manage, and present spatial or geographic data. The acronym GIS is sometimes used for geographic information science (GIScience) to refer to the academic discipline that studies geographic information systems and is a large domain within the broader academic discipline of geoinformatics. What goes beyond a GIS is a spatial data infrastructure, a concept that has no such restrictive boundaries.
In general, the term describes any information system that integrates, stores, edits, analyzes, shares, and displays geographic information. GIS applications are tools that allow users to create interactive queries (user-created searches), analyze spatial information, edit data in maps, and present the results of all these operations. Geographic information science is the science underlying geographic concepts, applications, and systems.
GIS is a broad term that can refer to a number of different technologies, processes, and methods. It is attached to many operations and has many applications related to engineering, planning, management, transport/logistics, insurance, telecommunications, and business. For that reason, GIS and location intelligence applications can be the foundation for many location-enabled services that rely on analysis and visualization.
GIS can relate unrelated information by using location as the key index variable. Locations or extents in the Earth space–time may be recorded as dates/times of occurrence, and x, y, and z coordinates representing, longitude, latitude, and elevation, respectively. All Earth-based spatial–temporal location and extent references should be relatable to one another and ultimately to a "real" physical location or extent. This key characteristic of GIS has begun to open new avenues of scientific inquiry.
Components of GIS
A working GIS integrates five key components: hardware, software, data, people, and methods. HARDWARE
Hardware is the computer on which a GIS operates. Today, GIS software runs on a wide range of hardware types, from centralized computer servers to desktop computers used in stand-alone or networked configurations. Software
GIS software provides the functions and tools needed to store, analyze, and display geographic information. Key software components are
Possibly the most important component of a GIS is the data. Geographic data and related tabular data can be collected in-house or purchased from a commercial data provider. A GIS will integrate spatial data with other data resources and can even use a DBMS, used by most organizations to organize and maintain their data, to manage spatial data.
PEOPLE
GIS technology is of limited value without the people who manage the system and develop plans for applying it to real-world problems. GIS users range from technical specialists who design and maintain the system to those who use it to help them perform their everyday work.
METHODS
A successful GIS operates according to a well-designed plan and business rules, which are the models and operating practices unique to each organization.

FUNCTION UNIT OF GIS
1: Data Capture: Data input to a geographical information system can be best broken into three categories: entering the spatial data, entering non-spatial data, and linking the two together.Entering the spatial data can be done numerous ways.Spatial data can be acquired from existing data in digital or paper form, or it can be collected from scratch.
Finding already mapped data in a paper format for an area can be accomplished in several ways.Paper map collections can usually be found within large libraries or universities. Libraries often times will also contain books with maps for international and domestic data. Another good resource for geographic data is local, state, or national government.Many countries have a wide range of data available at their country mapping agencies.If the data is to be more localized to a specific area, the local governments such as planning departments should contain the information.In addition, there are many commercial mapping companies that will sell data world wide for certain countries.The Internet is a good resource to search for data either from a vendor or a site offering free data. (Clarke, 2001)
There are two methods of getting paper maps into the computer: digitizing and scanning. Geocoding is the term used for the conversion of analog spatial information into digital form. Digitizing on a tablet captures map data by tracing lines by hand, using a cursor and an electronically sensitive tablet, resulting in a string of points with (x,y) values.Scanning involves placing a map on a glass plate while a light beam passes over it, measuring the reflected light intensity.The result is a grid of pixels.Image size and resolution are important to scanning. Small features on the map can drop out if the pixels are too big. (Clarke, 2001)
Finding data via the Internet can be done by performing a basic search. There are several sources for downloadable data such as:
Finally, if the data available does not meet the needs of the user, it can created by use of GPS, Remote Sensing, Aerial Photography, and field collection techniques.
2: Projection and Rectification In order for the spatial data of a 3-dimensional earth to be represented in a 2-dimensional GIS, the data must make use of one of the various projection methods (See Remote Sensing Section for further detail on projections).Because different projections place the same special entities on different coordinates on the flat surface, it is vital that a projection be set for the specific data set being used.One of the main features of a GIS is the ability to overlap different data layers for better analysis. These different layers must have the same projection, datum, and reference ellipsoid so that all coordinates are lined up correctly.

Reference Ellipsoid and Geoid. (SIC, 2002)
3: Data Modeling Spatial modeling represents the structure and distribution of features in geographical space.In order to model spatial processes, the interaction between these features must be considered.There are several types of spatial data models including: vector, raster, surface, and network (Burrough, 1998).

Integrated Layers of GIS Model (SIC, 2002)
4: Vector Data Model The vector data model is a method of storing and representing data on an X,Y Cartesian plane. A coordinate and an equation defining the curvature of each feature is stored for both the beginning and the end point of each feature. The building block of the vector structure is the point; lines and areas are composed of a series of points in a specific order that gives the object direction (Clarke, 2001) The attribute data in the vector model is stored in a separate table that can be linked to the map. Because every item on the map has its own separate attribute data, analysis can be very easy.For example, if a vector road network is being used to analyze the amount of carbon monoxide produced by cars per year in both rural and urban communities, each road would be capable of having separate attributes, thus allowing the GIS user to view or select each road and access information associated with just that road.Vector data entities in a GIS hold individual values, for example, if two lines overlap, unique values are recorded for each line in the database (spaghetti model).Selecting an appropriate number of points is another consideration to be made with vector data; if too few points are chosen, the shape and properties of the entity will be compromised and if too many points are used, duplicated information can be stored resulting in data overload (Burrough, 1998)

Vector Spaghetti Model (SIC, 2002)
5: Raster Data ModelThe raster data model uses a grid composed of rows and columns to display map entities.Each cell in the grid is equivalent to one map unit or one pixel.Spatial resolution determines the precision of spatial representation by raster data. The smaller the size of the pixel, the higher the resolution and the better the precision of spatial representation (Lo, 2002). An entity code is assigned to each cell that is connected to a separate attribute table, which provides information to the user as to what entity is present in what cell.

Figure: Raster Representation(SIC, 2002)

Figure: Raster Attribute Table(SIC, 2002)
The term raster data when applied to GIS and mapping includes scanned monochrome and color printing separates, scanned black and white and color aerial photographs, remote sensing images, digital elevation models, as well as thematic spatial data created by manual and computer-based methods (Lo, 2002). These methods of storing one or more values for each grid location in the data drastically increase the file size.Several methods have been developed to compact the size of raster files. The first is run length encoding which reduces data on a row-by-row basis.If an entity occupies a large number of cellsin a row, a single value is stored representing the object followed by the number of cells in that row, rather than recording each individual value. Another compaction technique is called the quadtree data model. In this model, instead of dividing the entire area into cells of equal size, only areas with specific details are broken down into smaller cells.For example, if a land-use map had only one land use type, one cell would represent the entire area.If there were 4 classes, 4 cells would be used, and quadrant that had more than one land use type would be broken down until it only contained one type (Lo, 2002).

Figure: Quadtree Compaction (SIC, 2002)

Figure: Run Length Encoding(SIC, 2002)
The raster data model represents spatial phenomenon such as topography, land use cover, and air quality as categorical or continuous surfaces.This makes raster-based methods particularly suitable for spatial modeling that involves multiple surface data sets.However, this method is not suitable for applications that rely on individual spatial features represented by points, lines, and polygons (Lo, 2002).6: Tabular Data Tabular data, also called attribute or descriptive data, is one of the most important elements in a GIS.It is statistical, numerical, or characteristic information that can be attributed to spatial features.Similar to spatial data the tabular data is stored by the GIS software in a method that allows it to be accessed and viewed, usually in a relational database format. Depending on the application, attributes that may be useful to assign to a feature would be population of an area, traffic measurement of a road, or types of landmines in a particular area.The GIS software allows the attribute data to be linked to the spatial data in such a way that it gives the attributes a location.A GIS package knows a specific location geographically from the storage of spatial data.By linking attribute data to the spatial data, the GIS package knows some of the characteristics of a feature in the spatial data set.
Two or more tabular databases can be linked when there is a common data filed.This allows the GIS to become a powerful spatial analysis tool.A GIS user, after integrating both spatial and attribute data, has the capability to learn a great deal about the defined study area.
Nature and type of Geographical data
Mainly there are two type of geographical data.They are spatial and Nonspatial data Spatial data, also known as geospatial data, is information about a physical object that can be represented by numerical values in a geographic coordinate system. Generally speaking, spatial data represents the location, size and shape of an object on planet, earth such as a building, lake, mountain or township. Spatial data may also include attributes that provide more information about the entity that is being represented. A spatial database is a database that is optimized to store and query data that represents objects defined in a geometric space. Most spatial databases allow representing simple geometric objects such as points, lines and polygons. Some spatial databases handle more complex structures such as 3D objects, topological coverage, linear networks etc. While typical databases are designed to manage various numeric’s and character types of data, additional functionality needs to be added for databases to process spatial data types efficiently. These are typically called geometry or feature. Spatial data are data that have a spatial component; it means that data are connected to a place in the Earth.
A Geographic Information System (GIS) integrates hardware, software, data, and people to capture, manipulate, analyze and display all forms of geographically referenced information or spatial data. A GIS allows see, understand, consult and interpret data to reveal relationships, patterns and trends. Most of the human activities are linked directly or indirectly to location. GIS or other specialized software applications can be used to access, visualize, manipulate and analyze geospatial data. Microsoft introduced two spatial data types with SQL Server 2008: geometry and geography. Geometry types are represented as points on a planar, or flat-earth, surface. Geography spatial data types, on the other hand, are represented as latitudinal and longitudinal degrees, as on Earth or other earth-like surfaces. There are different fields which need to manage geometric, geographic type of data in which data is related to space. Spatial data are the data related to objects that occupy space. Spatial data carries topological and distance information. A major difference between data mining in ordinary relational database and in spatial database is that attribute of neighbors of the some object of interest may have an influence on the object and have to be considered as well. A spatial database is a database that offers spatial data types in its data model and query language and supports spatial data types in its implementation, providing at least spatial indexing and spatial join methods. Spatial data may be accessed using queries containing spatial operator such as near, north, south, adjacent and contained in whereas non spatial data has accessed using queries containing operators such as insert, select, project, update, delete. A spatial database is optimized to store and query data that represents objects defined in a geometric space. Most spatial databases allow representing simple geometric objects such as points, lines and polygons. The development of specialized software for spatial data analysis has seen rapid growth as the lack of such tools was lamented in the late 1980s by Haining (1989) and cited as a major impediment to the adoption and use of spatial statistics by geographic information systems (GIS) researchers. Initially, attention tended to focus on conceptual issues, such as how to integrate spatial statistical methods and a GIS environment (loosely versus tightly coupled, embedded versus modular, etc.), and which techniques would be most fruitfully included in such a framework. Any data which are directly or indirectly referenced to a location on the surface of the earth are spatial data. The presence or absence of Latitude/Longitude or an OS Grid reference in the data is not a determining factor. For example, an experiment carried out in a laboratory may not appear to yield spatial data; however, if soil, water or vegetation samples used in the experiment were collected from a known location(s) the resulting data are spatial
1 SPATIAL DATA: There are following features in spatial data
FOR EXAMPLE: a person’s height and age are non-spatial data because they are independent of the person’s location.
SPATIAL DATA STRUCTURE:-RASTER AND VECTOR DATA
RATSER DATA: A representation of the world as a surface divided into a regular grid of cells. Raster models are useful for storing data that varies continuously, as in an aerial photograph, a satellite image, a surface of chemical concentrations, or an elevation surface. Raster data is made up of pixels (or cells), and each pixel has an associated value. Simplifying slightly, a digital photograph is an example of a raster dataset where each pixel value corresponds to a particular color. In GIS, the pixel values may represent elevation above sea level, or chemical concentrations, or rainfall etc.
ADVANTAGE OF RASTER DATA
CONCEPT OF GPS


Functions and working principle of GPS


Comments
Post a Comment